3. Results
3.1 Experiment 1 results
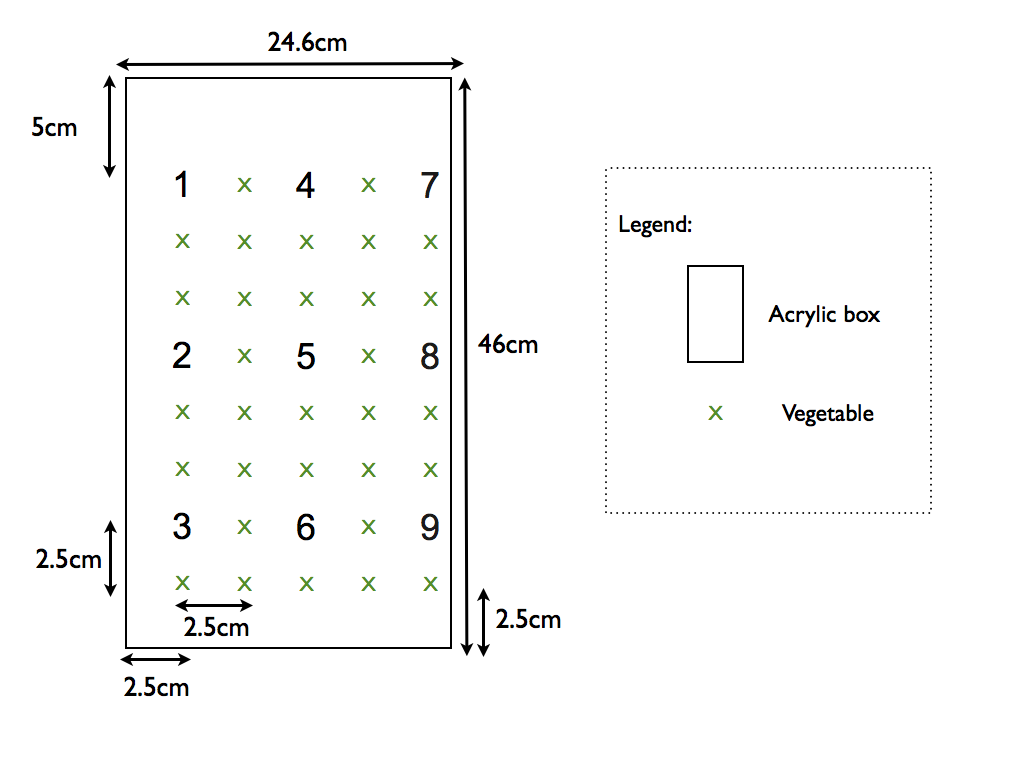 |
| Figure 3.1.1 - Plants measured in the vertical garden (Numbered)
|
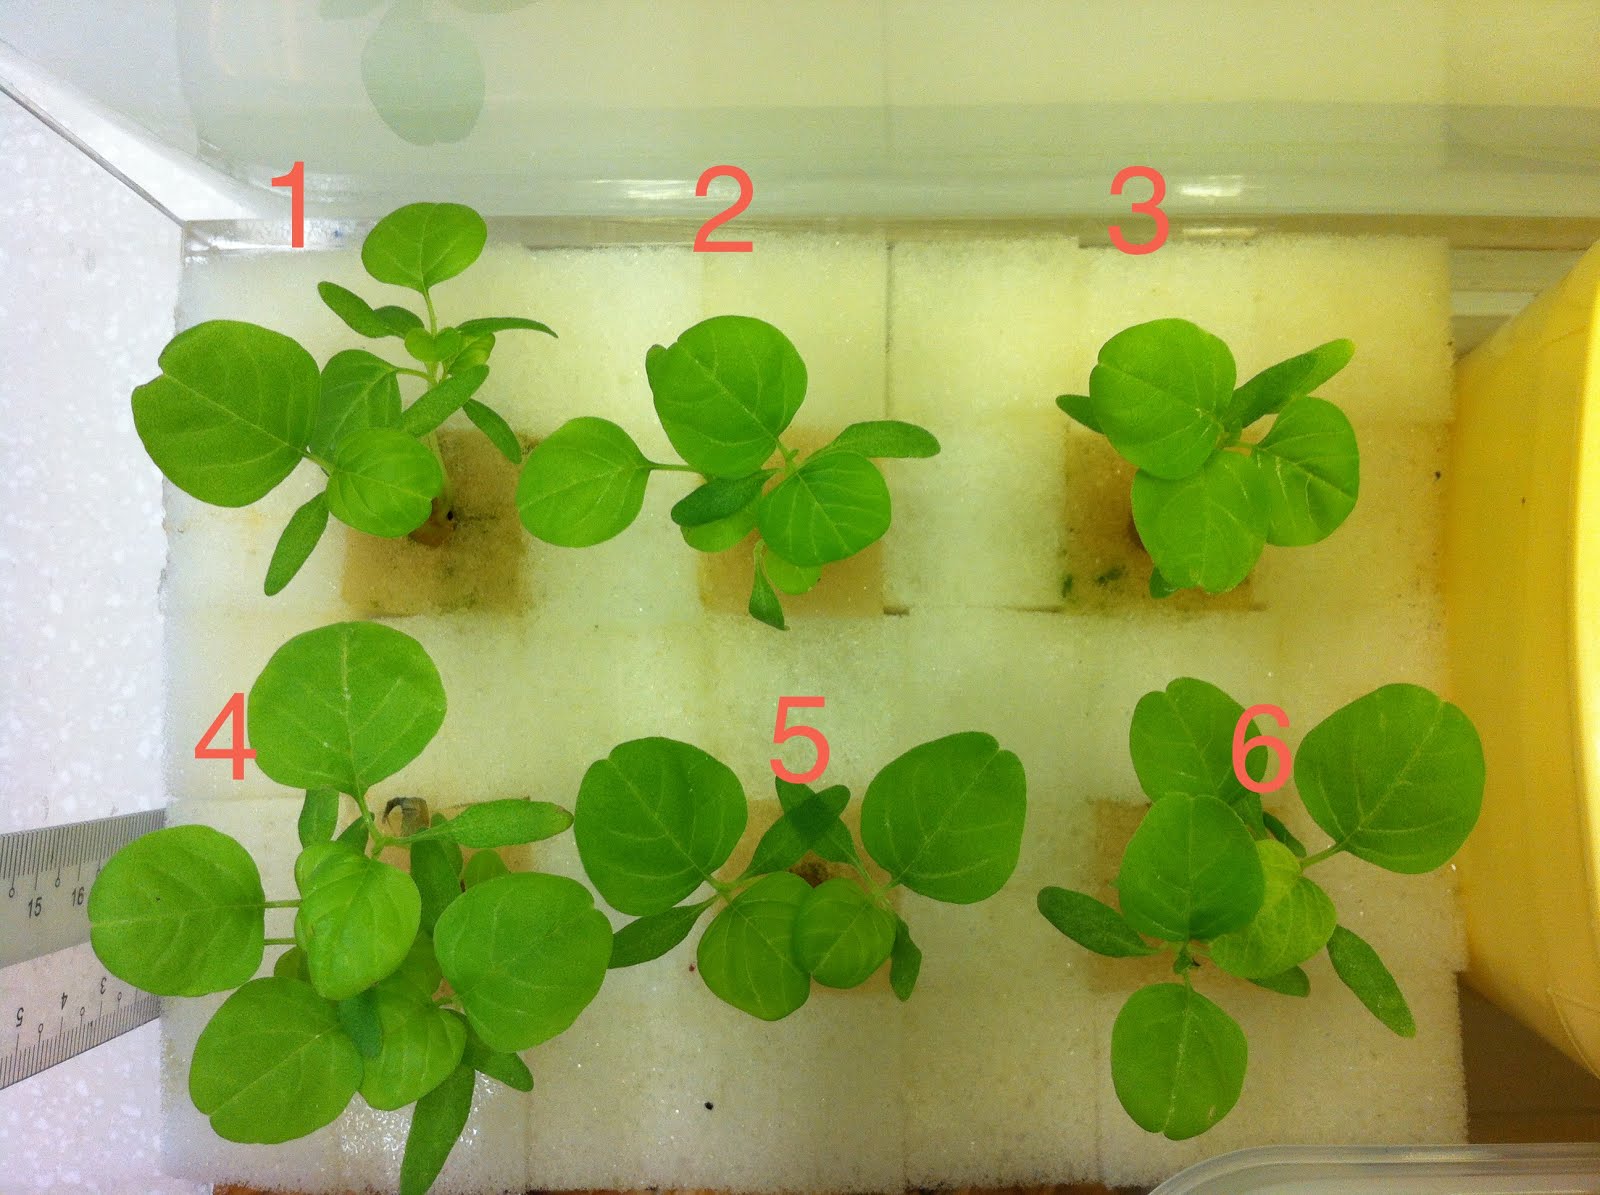 |
| Figure 3.1.2 - Sponge constant
|
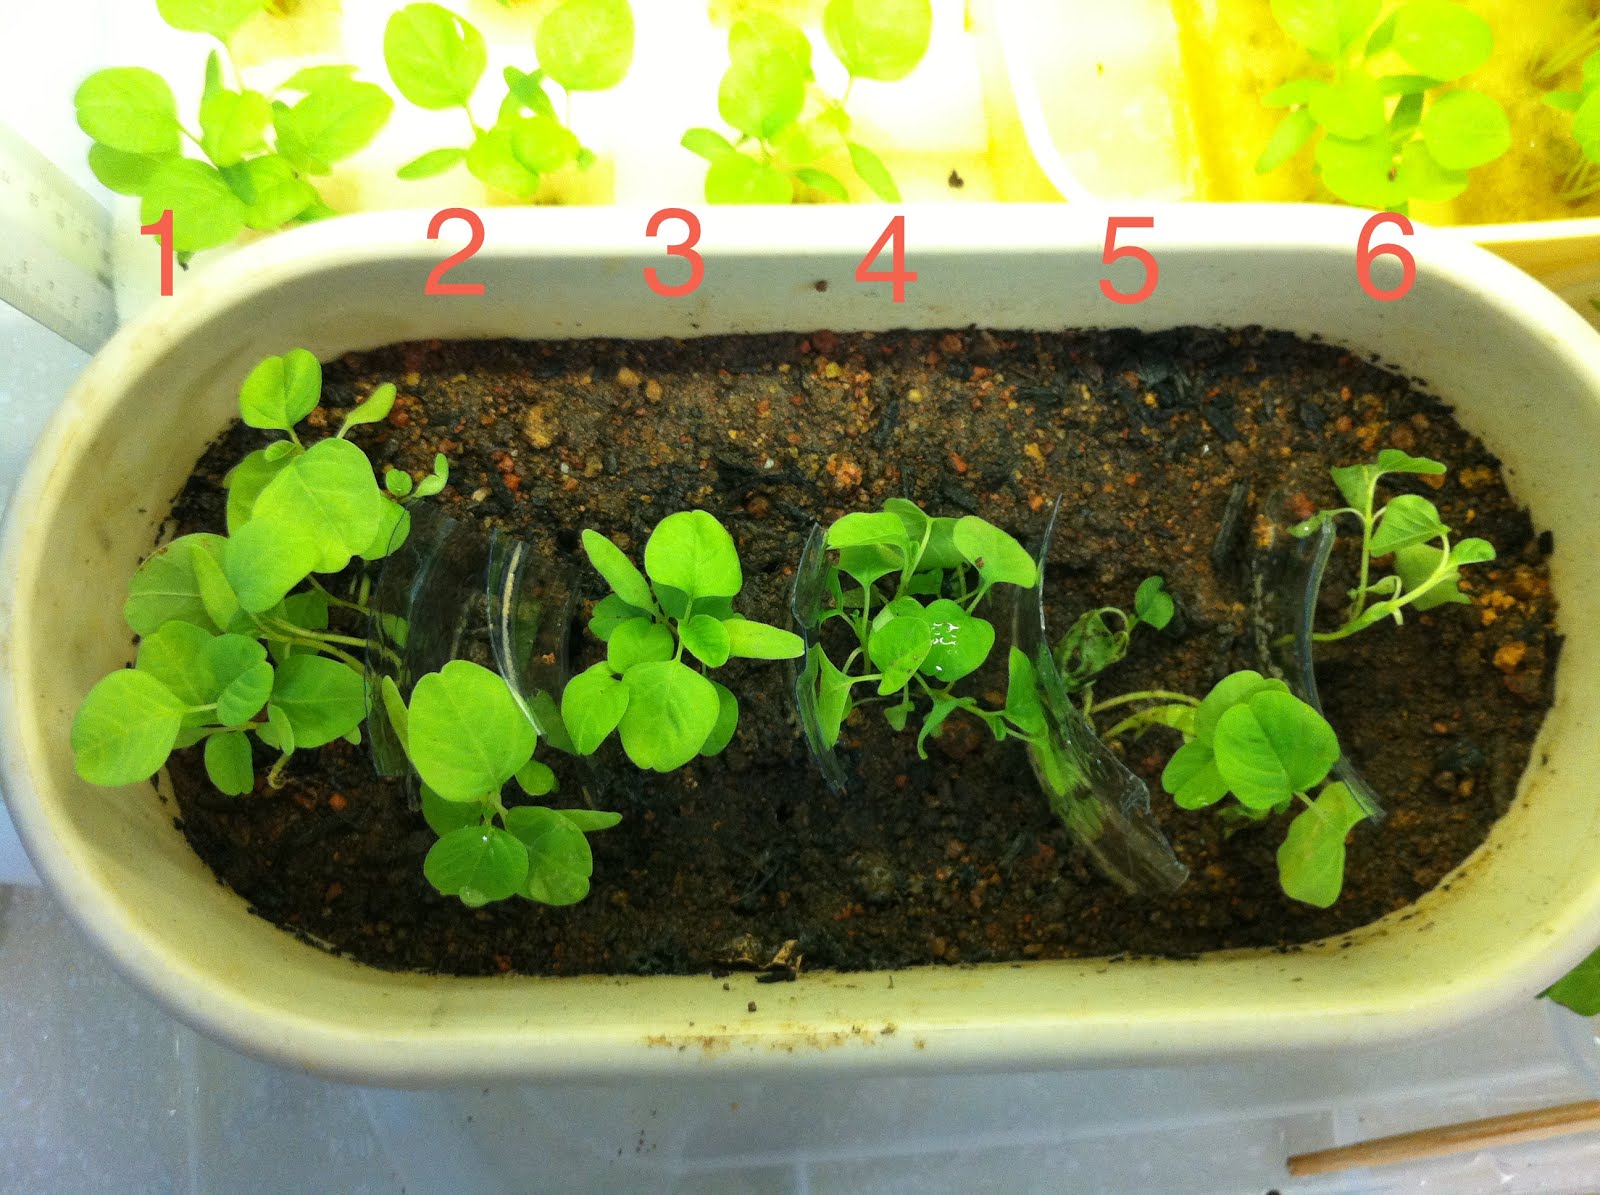 |
| Figure 3.1.3 - Soil constant
|
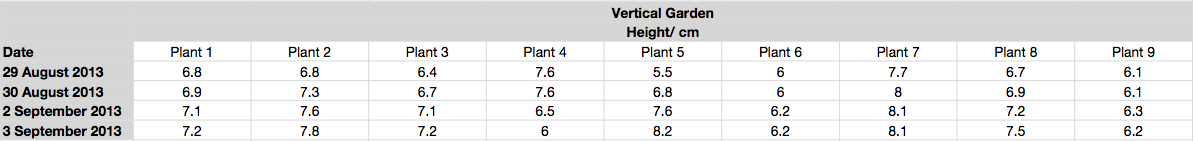 |
Figure 3.1.4 - Vertical garden plant measurements
|
 |
Figure 3.1.5 - Sponge constant plant measurements
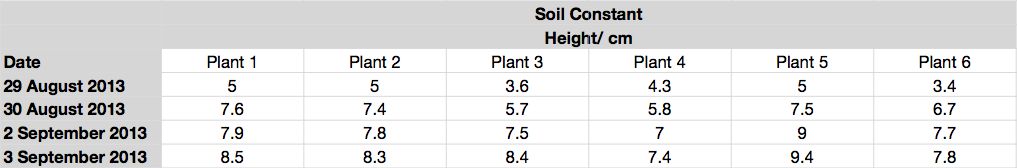 |
Figure 3.1.6 - Soil constant plant measurements
|
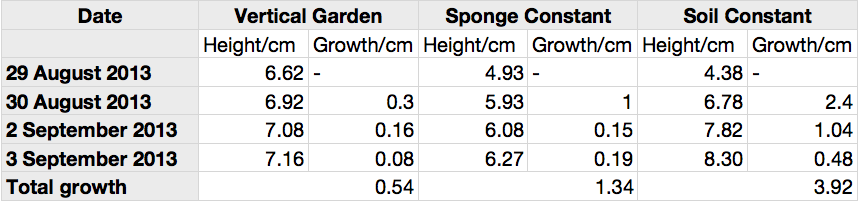 |
| Figure 3.1.7 - Averages
|
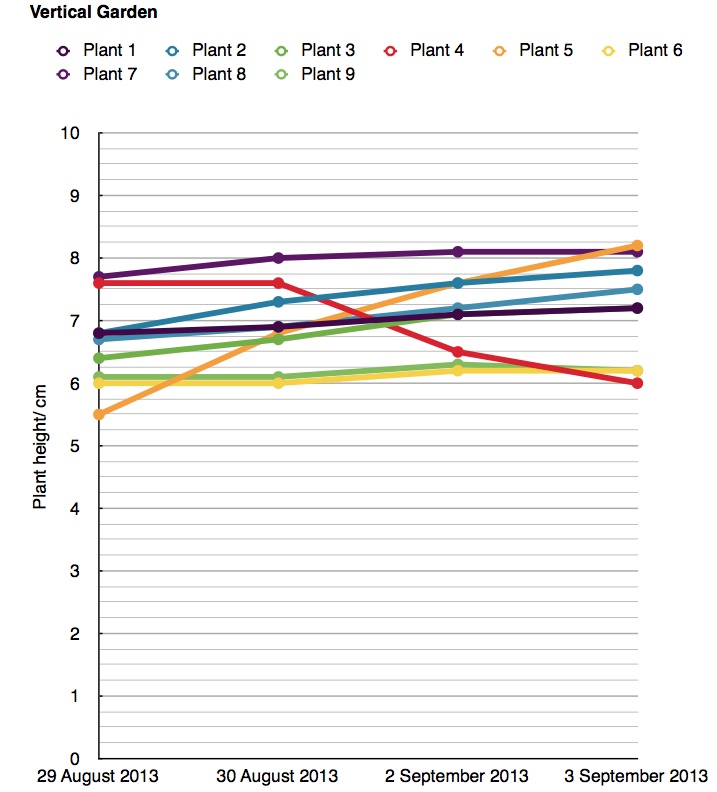 |
| Figure 3.1.8 - Vertical garden plant graph
|
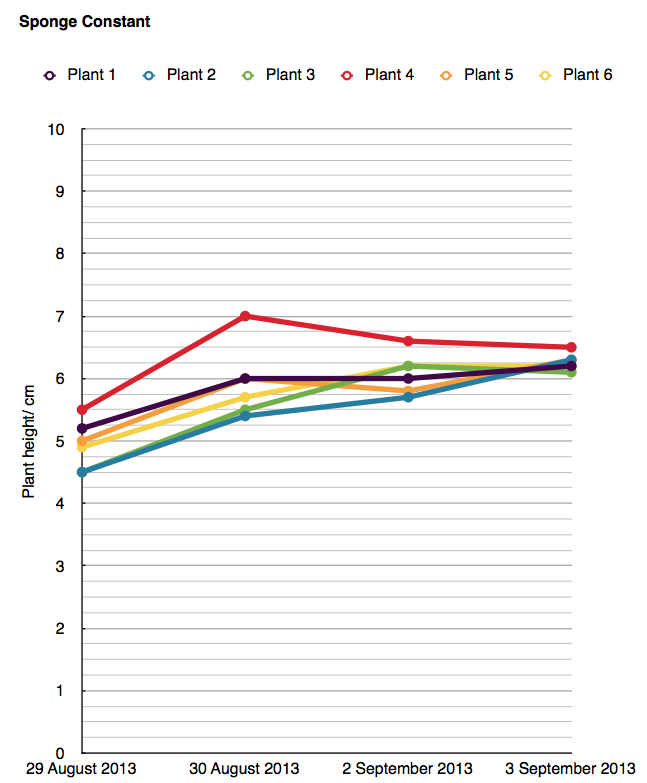 |
| Figure 3.1.9 - Sponge constant plant graph
|
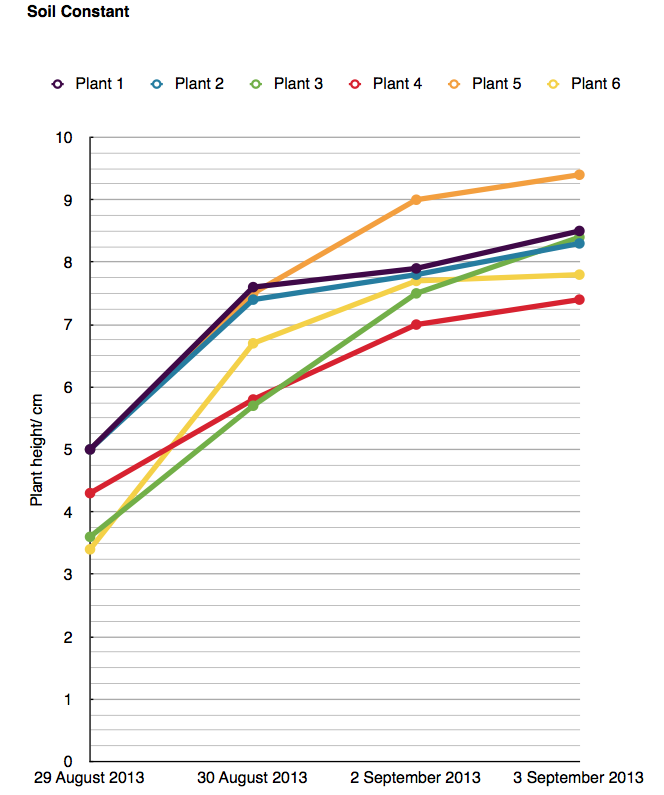 |
Figure 3.1.9a - Soil constant plant graph
|
3.2 Experiment 2 results
Test No.
|
Timing / sec
|
Distance travelled by water / cm
|
1
|
3.1
|
46
|
2
|
2.8
|
46
|
3
|
2.8
|
46
|
Average: 2.9 seconds for 46cm of water travelled
Flow rate is 15.9cm/s = 0.159m/s (3 significant figures)
3.3 Experiment 3 results
We found that the cup with the sponge managed to hold the water and prevent a faster rate of evaporation than compared to the cup with uncovered water. Even so, the difference in the amount of water is rather small. Both of the cups started off with 7.39ml each and were left in the same conditions as the vertical garden for a period of 21 hours.
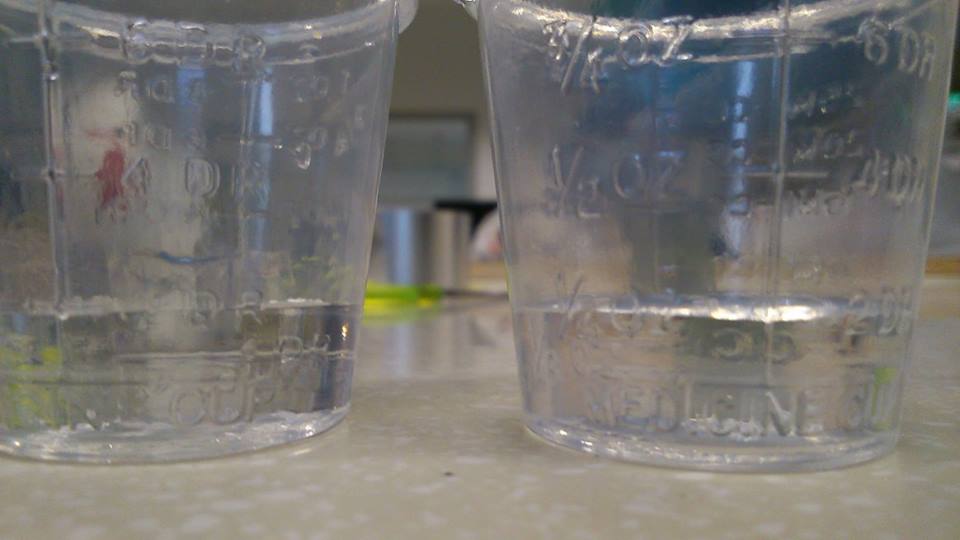
Figure 3.3.1 - Starting of experiment (Sponge not shown)
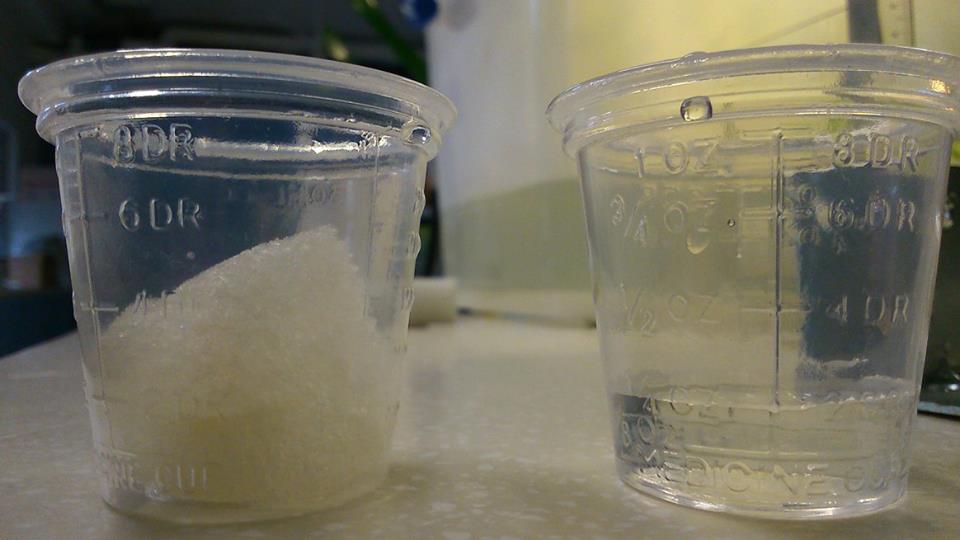
Figure 3.3.2 - Experiment Setup
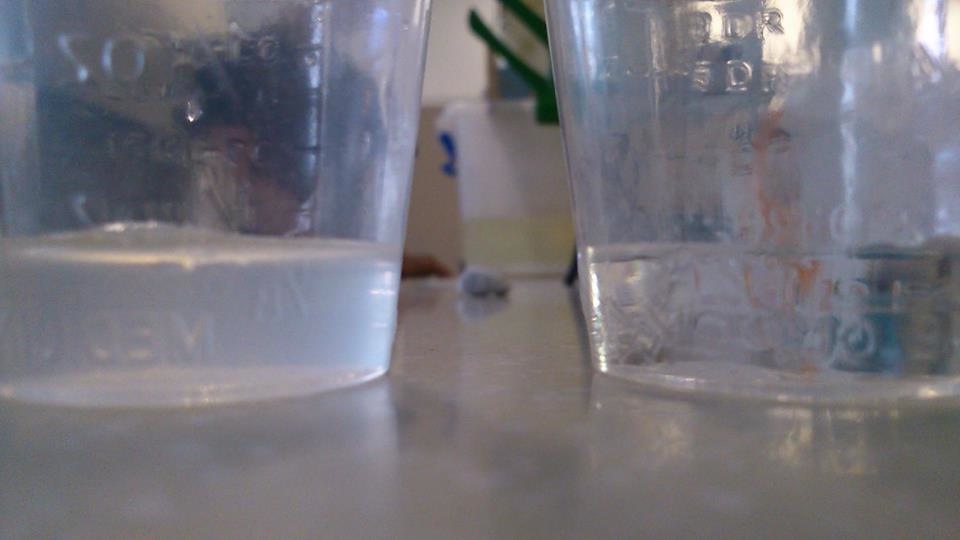
Figure 3.3.3 - End of experiment (Cup with murkier water had the sponge)
3.4 Special observations
The plants on the uppermost row are growing upwards despite the light source being downwards. This could have happened due to turgidity of the stem after the absorption of water, The sponges were dry when we first watered the plants. Only after watering the plants, the plants started to grow upwards. This could be an indicator of the plant absorbing water and that the medium of cultivation (sponges) is sufficient enough for growth. There may be negative phototropism here, where the plant grows away from the light source. It has lesser chance of drying out then (BBC, 2009).
No comments:
Post a Comment